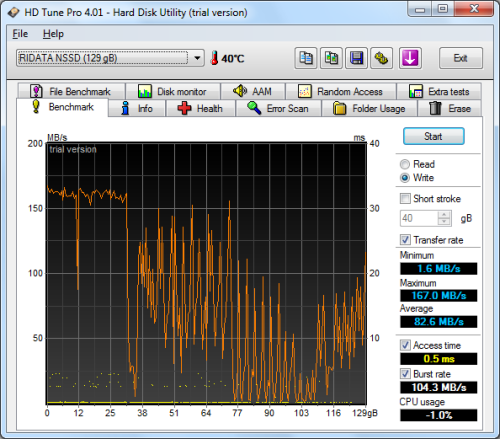
HD Tune Pro 4.01:
Next, I ran a series of tests using HD Tune Pro. This hard disk utility measures a drive's performance by testing its sequential read and write speeds as well as its access time, burst rate and CPU usage. For this review, I'm also going to use it to benchmark the X Series' random read and write speeds, random access times and the number of operations per second.
RiDATA's X Series SSD performed fairly well when reading. The drive had an average transfer rate of 213.5 MB/s and an access time of 0.2 ms. When writing, the X Series started out at about 160 MB/s, but then quickly dropped off, ending with an average speed of only 82.6 MB/s.
RiDATA really doesn't say what the X Series is capable of in regards to IOPS. In our tests, the drive achieved 3087 IOPS and an average speed of 12.059 MB/s when reading 4K blocks. While not earth shattering, this is about average for a drive of this caliber. Unfortunately, the X Series did not perform nearly as well when writing. Looking at the screenshot above, you can see that the drive achieved only 557 IOPS and an average speed of 2.179 MB/s.
Iometer:
Lastly, I ran a series of tests using Iometer. This tool can be configured to benchmark a number of things. In this case, I used it to measure the X Series' read and write speeds and the number of operations per second. These tests were run using blocks ranging from 512B to 2MB in size.

The X Series' sequential read and write speeds were very similar to what we saw in our other tests. With a 2MB block, the drive reached average read and write speeds of 225.05 MB/s and 205.32 MB/s, respectively. The X Series wasn't as fast when doing random reads. However, the biggest performance hit came when doing random writes. With a 2MB block, the drive had an average speed of only 25.21 MB/s.

The performance here was very similar to what we saw with HD Tune. In our tests, the drive reached 3099 IOPS when doing a random read and 544 IOPS when doing a random write with 4K blocks. Digging a little deeper I found that the latency was also very high when doing random writes. With 4K blocks, the average response time averaged between 4-6 ms and in some cases peaked as high as 1700ms.
To see if this was a caching issue, I went back and reran the 4K random read and write tests by themselves. As you can see below, the performance was greatly improved. The IOPS and transfer rate speeds were not only higher, but the average response time was a tenth of what we saw when the benchmarks were run with with the others.
| Transfer Rate |
IOPS | Average Response Time |
Maximum Response Time |
|
| 4K Block - Read | 13.24 MB/s | 3391 | 0.59ms | 19.66ms |
| 4K Block - Write | 5.63 MB/s | 1442 | 1.38ms | 997.50ms |


